OpenTelemetry, time series, metrics and a bit of Rust
2023-05-20
OpenTelemetry is a collection of tools, APIs, and SDKs. Use it to instrument, generate, collect, and export telemetry data (metrics, logs, and traces) to help you analyze your software’s performance and behavior.
Let’s break down the statement from OpenTelemetry website to better understand it. And of course, let’s start by the end “help you analyze your software’s performance and behavior”.
The life of software running on production
No software is perfect and every software will misbehave. It’s just a matter of time. If the software is running on your machine, you can probably check the logs, reproduce the issue a couple of times and find what is the problem. You probably can do that if the software is running on a server as well. But the life of software is much more than the bugs we have acknowledged.
If your software is used by hundreds of people, it’s going to be much more difficult to observe only based on logs if everything is ok. Also, not everything is about your software, sometimes users may not be able to get the service quality they want due to another component using 100% of the CPU time. Long story short: we cannot rely only on logs. We need metrics!
Metrics
Metrics are aggregations over a period of time of numeric data about your infrastructure or application. Examples include: system error rate, CPU utilization, request rate for a given service. - OpenTelemetry docs
I find it easier to visualize metrics than to write about them. So imagine we have a metric called “Memory Usage” which measures the percentage of memory used every minute. We would have something like:
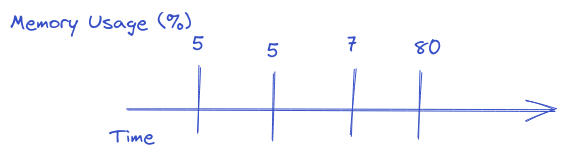
That would help us to answer questions like: what is the memory usage of the last 5 minutes? What was the aggregated memory usage of the last hour?
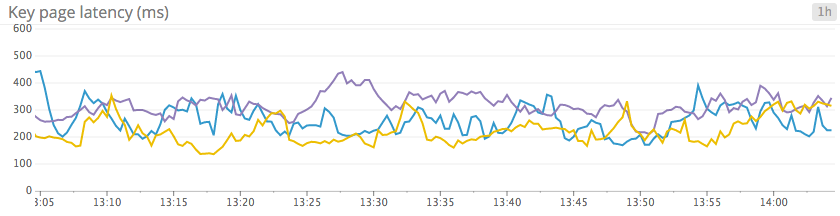
Metrics normally don’t make sense on their own. If you have a single metric for a single minute, there is not much you can discover about the software you are looking at. We are normally interested in the behaviour of the system over a period of time. So we normally plot those metrics as a line chart.
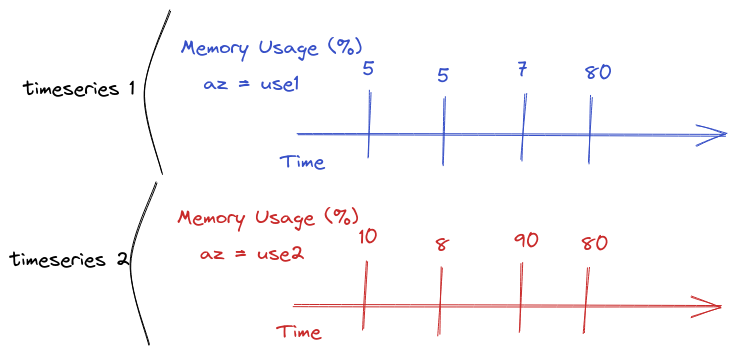
There is something missing in my explanation, in a world where software is deployed on different machines, different regions and different setups, having raw data of “memory usage” is useless if we cannot categorize this data per the different dimensions our software stack has.
People call those dimensions different things, such as tags and labels. To simplify things I will only use tags. Tags help us to answer questions like: “Which Availability Zone has the higher rate of errors?”, “Which server has the higher CPU usage rate?”, “Which version of the software has the lower response time?”. All of that is by grouping the metrics by different tags.
Let’s pause a bit, and define another term. Time-series. A time series refers to a sequence of data points collected or recorded in chronological order. It represents the measurement or observation of a variable or multiple variables over time. So from now on, instead of saying “metric x over the last y minutes”, I will just say the metric x time series.
Ok, let’s continue. So as we were talking, tags are very important for our time series. It helps us to group by different points of view. So we should to make them right! If you use a tool like HoneyComb you are probably not worried about high cardinality, otherwise, you should!
But wait, we haven’t talked about cardinality yet! Honeycomb’s doc says: “The dimensionality of a dataset is the number of different attributes that it has. A high-dimensionality dataset, then, has many different attributes.”. Let’s go back to our tags. Let’s say we have: host_ip, availability_zone (az) and region tags for all of our metrics. Even if the number of hosts is big, we are not concerned with high dimensionality for this dataset. We should not expect a huge number of availability zone (e.g. AWS have very few per region), or even region. So our cardinality is bound to be low.
Well, let’s imagine that we add a request id tag to our metrics, and request_id is a uuid. We can bet it will have high cardinality. But, why this is bad?
Time-series databases normally optimize the queries based on the tags and time. Having an infinite number of tag values for a specific tag means they will have an infinite number of time series to scan, which will have a high cost for most of their designs.
Some people call metrics with high-cardinality data “events”. One of the reasons is that if we have high-cardinality data, there is a big chance that we are not aggregating data anymore. Events are not exactly that, but we will discuss it on the next topic.
Structured Events
In contrast to metrics, events are snapshots of what happened at a particular point
in time. One thousand discrete events may have occurred within that same trailing five-second period in the preceding example - Honeycomb’s O’Reilly Book Observability Engineering
OpenTelemetry does not have the “structured event” concept, but I find it useful as a building block concept for understanding distributed tracing.
I will follow Honeycomb’s book definition: “An event is a record of everything that occurred while one particular request interacted with your service”.
So let’s imagine you have a map for each request made for your service where the key is the name of a dimension or metric name and the values, well, are the metric or dimension value. If you store them in a database and later retrieve them by (only an example) request id. It would be possible to know all the details of that particular request: how long it took, which user initiated it and so on.
{
  "request_id": 123,
  "user_id": 456,
  "response_time": 300,
  "params": ["something=else"],
  "database_response_time": 200,
}
You can pick one of those dimensions and try to aggregate it to create a time series, but there is a lot of value in picking it up and looking directly at a single structured event.
Distributed Tracing
Distributed traces are simply an interrelated series of events - Honeycomb’s O’Reilly Book Observability Engineering
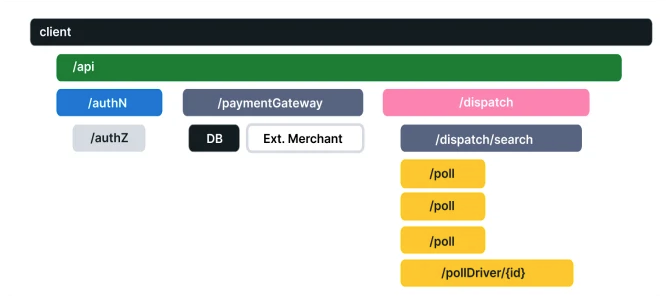
Let’s build on top of the structured events. What if a user request to your system would mean that a couple of internal services would be called before the response is sent back to them? So, let’s say that we have something like:
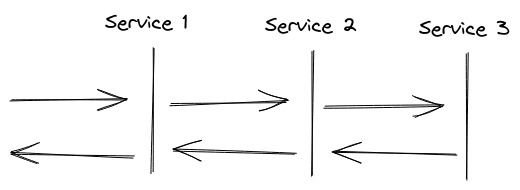
From our previous definition, each service would store its own structured event and it would not be possible to connect the three together. In the image, we could share the same request id, but imagine that service 1 sends 3 or 4 requests to service 2. Service 2 would have 3 or 4 structured events (one for each request) and it would be very confusing to connect everything together.
OpenTelemetry has a nice set of standards for us to follow in order to create well-structured traces. The first concept is the “Span”, you know what I just called in the previous paragraph “each service structured event”? We are now going to call it Span. A span represents a unit of work or operation.
Every span has a set of attributes which I will not detail. Although I need to talk about a few important to our initial problem: how to connect those spans together.
- All of the Spans related to the same request will have the same trace id (which is somewhat similar to what we were calling request id)
- All of the Spans will have span id
- All (except the root) spans will have a parent span id, which as the name says it’s the id of the span which made the request to that specific span.
With all that data you can construct waterfall charts just as the one in the OpenTelemetry documentation:
As they say on the website “Waterfall diagrams show the parent-child relationship between a root span and its child spans. When a span encapsulates another span, this also represents a nested relationship.”
Instrument your code
The theory was nice, but how can we use OpenTelemetry?
Note: As I write this, the status of the
Metricsupport for Rust on OpenTelemetry is Alpha, so you can expect it to change fast. As I researched to write this examples I found many posts/examples that were just not working anymore. Now they do have a working example on the official repo, so I would expect it to always work with the latest crate version: https://github.com/open-telemetry/opentelemetry-rust/blob/main/examples/metrics-basic/src/main.rs
I’m using OpenTelemetry new SDK API. As I write it’s not released it at crates.io, so we need to fetch directly from Github:
opentelemetry_api = { git = "https://github.com/open-telemetry/opentelemetry-rust.git", features = ["metrics"] }
opentelemetry_sdk = { git = "https://github.com/open-telemetry/opentelemetry-rust.git", features = ["rt-tokio"] }
opentelemetry-otlp = { git = "https://github.com/open-telemetry/opentelemetry-rust.git", features = ["tonic", "metrics"] }
About the code, let’s for sake of the example create a super simple webservice that just returns “Hello World” with actix-web.
#[actix_web::main]
async fn main() -> std::io::Result<()> {

    HttpServer::new(|| App::new().service(index))
        .bind(("127.0.0.1", 8080))?
        .run()
        .await;

    Ok(())
}

#[get("/")]
async fn index() -> impl Responder {
    "Hello, World!"
}
Ok, so now we need to instrument our code. OpenTelemetry allow users to properly handle metrics, traces and logs. Logs is not yet implemented for Rust SDK and for the sake of simplicity let’s only setup metrics.
OpenTelemetry works with different vendors, but let’s go full on OpenTelemetry and use their own protocol: OTLP:
fn init_meter_provider() -> metrics::Result<MeterProvider> {
    let export_config = ExportConfig {
        endpoint: "http://localhost:4317".to_string(),
        ..ExportConfig::default()
    };
    opentelemetry_otlp::new_pipeline()
        .metrics(runtime::Tokio)
        .with_exporter(
            opentelemetry_otlp::new_exporter()
                .tonic()
                .with_export_config(export_config),
        )
        .build()
}
That code uses the opentelemetry_otlp crate to define our new pipeline.
Now we need to call that method on our main:
#[actix_web::main]
async fn main() -> std::io::Result<()> {

    let meter_provider = init_meter_provider().unwrap();

    HttpServer::new(|| App::new().service(index))
        .bind(("127.0.0.1", 8080))?
        .run()
        .await;

    meter_provider.shutdown().unwrap();
    Ok(())
}
Great! Let’s emit a metric everytime someone access our webservice. There are different types of metrics and the following are the supported by OpenTelemetry SDK (quoting their documentation)
- Counter: A value that accumulates over time – you can think of this like an odometer on a car; it only ever goes up.
- Asynchronous Counter: Same as the Counter, but is collected once for each export. Could be used if you don’t have access to the continuous increments, but only to the aggregated value.
- UpDownCounter: A value that accumulates over time, but can also go down again. An example could be a queue length, it will increase and decrease with the number of work items in the queue.
- Asynchronous UpDownCounter: Same as the UpDownCounter, but is collected once for each export. Could be used if you don’t have access to the continuous changes, but only to the aggregated value (e.g., current queue size).
- (Asynchronous) Gauge: Measures a current value at the time it is read. An example would be the fuel gauge in a vehicle. Gauges are always asynchronous.
- Histogram: A histogram is a client-side aggregation of values, e.g., request latencies. A histogram is likely a good choice if you have a lot of values, and are not interested in every individual value, but a statistic about these values (e.g., How many requests take fewer than 1s?)
Let’s count the number of requests, so let’s use counter:
#[get("/")]
async fn index() -> impl Responder {
    let cx = Context::current();
    let meter = global::meter("hello_world_saas");
    let counter = meter.u64_counter("requests").init();
    counter.add(&cx, 1, &[KeyValue::new("server", "my_pc")]);
    "Hello, World!"
}
So we get our requests counter from our hellow_world_saas meter and we increment by one using the tag server with the value my_pc.
And yeah, that is it! Emitting metrics should always be super simple, the main problem is really finding the right ones to emit. If you don’t want to think too much about it, you can use something like https://autometrics.dev/ to automatically generate the most useful metrics for you and you can add your own custom metrics as you go.
The Data Collector
The OpenTelemetry project facilitates the collection of telemetry data via the OpenTelemetry Collector. The OpenTelemetry Collector offers a vendor-agnostic implementation on how to receive, process, and export telemetry data. It removes the need to run, operate, and maintain multiple agents/collectors in order to support open source observability data formats (e.g. Jaeger, Prometheus, etc.) sending to one or more open source or commercial back-ends. In addition, the Collector gives end-users control of their data. The Collector is the default location instrumentation libraries export their telemetry data. - OpenTelemetry documentation
So how you expose your data now that we have instrumented our code? Well, you could push your data directly to whatever backend you are using for your telemetry, but as OpenTelemetry tells “In general we recommend using a collector alongside your service, since it allows your service to offload data quickly and the collector can take care of additional handling like retries, batching, encryption or even sensitive data filtering.” That is the “agent” mode, we could also have a gateway where multiple machines push to it. Another option would be to let something pull your metrics. For example, you could expose a /metrics endpoint where a Prometheus instance would pull the metrics from your service.
The “agent” mode looks like this:
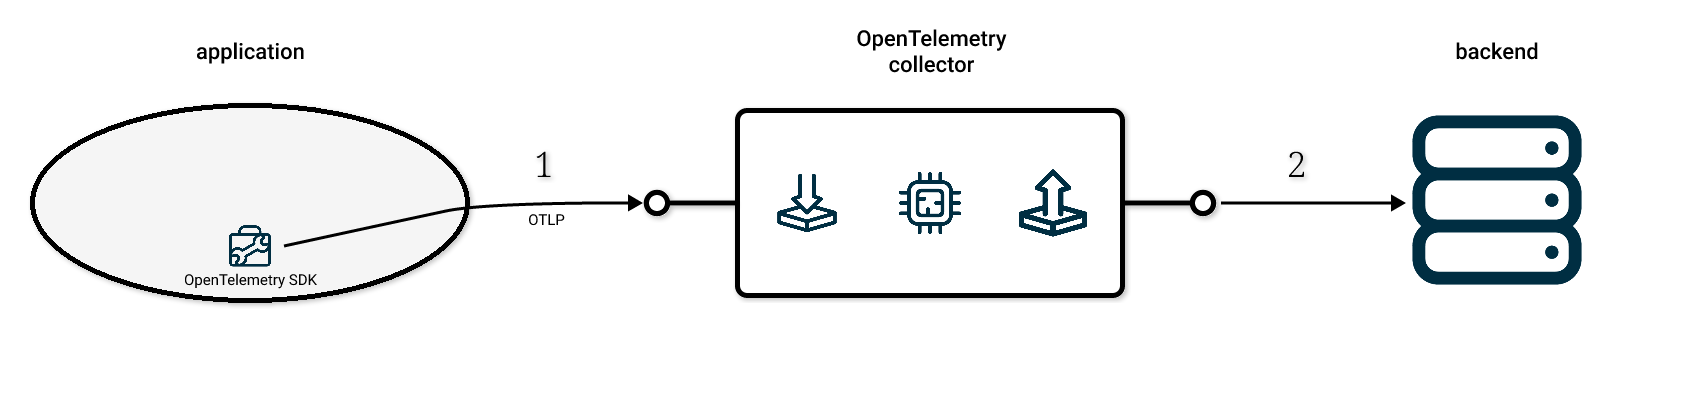
Where your application and the collector are on the same machine.
If you want to try another mode check out the “Getting Started” and “Deployment” sections of their documentation.
Our service pushes the metrics using gRPC and the collector handles whatever backend we are using (e.g. Prometheus). This works fine because the Collector, as the documentation says, is made of four components:
- Receivers: How to get data into the Collector; these can be push or pull based
- Processors: What to do with received data
- Exporters: Where to send received data; these can be push or pull based
- Connectors: A connector is both an exporter and receiver. It consumes data as an exporter in one pipeline and emits data as a receiver in another pipeline
You can setup the collector easily with different modes, but in our case we just want to see it collecting data, so let’s use the following configuration
# otel-collector-config.yaml
receivers:
  otlp:
    protocols:
      grpc:
        endpoint: 0.0.0.0:4317

exporters:
  logging:
    loglevel: debug
  file:
    path: /etc/otelcol/metrics.json

processors:
  batch:

service:
  pipelines:
    metrics:
      receivers: [otlp]
      processors: []
      exporters: [logging, file]
And if we run this using the docker:
docker run  \
    -p 4317:4317 -p 13133:13133 \
    -v $(pwd)/otel-collector-config.yaml:/etc/otelcol/config.yaml \
    -v $(pwd)/metrics.json:/etc/otelcol/metrics.json \
    otel/opentelemetry-collector:latest
We should now have a collector running on our machine. And if you tail -F the metrics.json file that we mapped through docker you should see our metrics:
{
  "resourceMetrics": [
    {
      "resource": {
        "attributes": [
          {
            "key": "service.name",
            "value": {
              "stringValue": "unknown_service"
            }
          }
        ]
      },
      "scopeMetrics": [
        {
          "scope": {
            "name": "hello_world_saas"
          },
          "metrics": [
            {
              "name": "requests",
              "sum": {
                "dataPoints": [
                  {
                    "attributes": [
                      {
                        "key": "server",
                        "value": {
                          "stringValue": "my_pc"
                        }
                      }
                    ],
                    "startTimeUnixNano": "1684482478787681712",
                    "timeUnixNano": "1684482768597127582",
                    "asInt": "1"
                  }
                ],
             ......
The full example is available at: github/era/rust_opentelemetry_with_otlp_example.
The advantage of using OpenTelemetry instead of something like Prometheus or even more proprietary software (HoneyComb, CloudWatch, …) directly is that if we ever change our telemetry backend, we don’t have to worry about changing all of our services with new SDKs. Another point is that maybe for production you want to use some paid service, but for dev you just want to use Prometheus since it’s super quick and cheap to setup.
Monitoring and Observability is an important part of any production system. If you want to read more about it I do recommend Honeycomb’s book and Practical Monitoring: Effective Strategies for the Real World.
The end
I hope this quick introduction to metrics and OpenTelemetry is useful for someone. If you want to discuss something or you have a opensource project that you want some help with, just ping me on twitter or send me an email at rust@{{this_domain}}.